

Across the largest datasets published in 2026, a normal LinkedIn connection acceptance rate is 26% to 28.5% of invites sent. Expandi's own acceptance guide calls 30% to 45% good and anything under 20% a red flag. Reply rate depends on how it is counted: 7% to 10% of messages sent get a reply, while 14% to 28% of accepted connections reply at least once. Three datasets publish a meeting rate from their own data: 1.3% of connected prospects in one outbound agency's own client campaigns, 1.3% of accepted connections in SmartReach's first-party data, and 2% of accepted in a LinkedIn outreach provider's 2026 platform data. Only the provider publishes the meeting count behind its rate.
Two platforms supply most of the volume. Expandi's 2026 benchmark covers 13.2 million connection requests and reports 28.5% acceptance and a 10.4% message reply rate (the 15.1 million-contact partner dataset in the agency study below also comes from Expandi's platform). SmartReach's State of LinkedIn Outreach 2026 covers 500,000+ requests and reports 26% acceptance. A third 2026 study, from a LinkedIn outreach provider's own platform, is smaller, at 180,155 requests, but it is the only one of the three that publishes the number of meetings behind its meeting rate.
All three are vendor data from their own users, so read them as a population average. Your own target depends on who you are inviting.
The rest of this page puts every number side by side, labels what each one is divided by, and turns the percentages into meetings per month.
The compiled benchmark table
Every figure below was checked against its source in September 2026, and the platform-wide numbers get the same treatment in LinkedIn B2B statistics, checked against the source. The column that matters most is the denominator, because it explains most of the disagreement between sources.
| Source (sample, window) | Acceptance, per invite sent | Reply rate | Reply is divided by | Meeting rate |
|---|---|---|---|---|
| Expandi platform data (13.2M requests, 13,302 accounts, May 2025 to Apr 2026) | 28.5% | 10.4% | messages sent | not reported |
| Agency study, partner data from Expandi (15.1M contacts, calendar 2025) | 26% | 7.2% | messages sent | not reported |
| Agency study, own client campaigns (14,077 contacts, 34 projects, 2025) | 18.7% | 17.6% | connected prospects | 1.3% of connected |
| SmartReach (500,000+ requests, 160+ businesses, Jan to Jun 2026) | 26% average, top quarter above 40% | 14% without a note, 22% with one | accepted connections, once per prospect | 1.3% of accepted (first-party, rep-recorded, reported as a floor; no meeting total published) |
| Provider platform data (180,155 matured requests, sent Jan 2025 to Jul 2026) | 27.1% | 27.6% | accepted connections, at least one inbound message | 2.0% of accepted (platform-booked only, a floor) |
| Agency benchmark post (method mostly not disclosed) | 25% to 35% "average", 35% to 45% "strong" | by industry only | not stated | not reported |
The two agency study rows come from one outbound agency's 2026 LinkedIn outreach study, which uses two separate datasets and says so.
The last row comes from a second agency's benchmark post, which does not disclose a sample for most figures, so I use it only where another source points the same way. The provider platform row comes from a LinkedIn outreach company that also sells done-for-you campaigns.
All three compete in my own market, so I cite them in plain text and do not name or link them.
One more column is worth adding yourself: replies per invite sent, end to end. Multiply acceptance by reply per accepted connection. SmartReach gives about 5 replies per 100 invites (26% x 18%). The agency's own client funnel gives about 3 (18.7% x 17.6%). The provider study measures it directly: 7.5 replies per 100 invites. That is the number to compare with your own dashboard if your tool counts everything from the invite.
Why the numbers seem to contradict each other
Put 7.2%, 10.4%, 17.6% and 22% on one slide and it looks like nobody agrees. Most of the gap disappears once you see what each source divides by.
- Per message sent. Expandi and the agency study's partner data count replies against every outbound message. One prospect who gets three messages and answers once counts as one reply out of three. This produces the lowest numbers.
- Per accepted connection. SmartReach counts a prospect once, however many messages they got. The agency's own 17.6% and the provider study's 27.6% work the same way. These numbers run two to three times higher.
- Per invite sent. The strictest version. It folds acceptance in, which is why it lands in single digits.
What counts as a reply also varies. The provider study counts a "not interested" as a reply. LinkedIn does something similar in its own product: the Recruiter Lite InMail report counts an InMail as answered when it is accepted or declined within 30 days. A polite no lifts the rate, so check what your tool counts before you compare it with anyone's benchmark.
Two gaps remain that no source explains. The agency study reports 26% acceptance from Expandi data for calendar 2025, while Expandi's own report for May 2025 to April 2026 says 28.5%. The windows differ by four months and the pages never reconcile them.
And the agency's own client campaigns accepted at 18.7%, well below the platform average in the same study. Overloop's roundup notices a separate split, with the agency study and Expandi disagreeing about whether January is a strong or weak month, and advises judging January against your own baseline.
My reading: a 2 or 3 point difference between two vendors is noise. A 2x difference usually means different denominators.
Reply rate by industry
Industry moves reply rates more than almost anything you write. Three sources with different industry labels agree on the order, even where the exact figures differ.
| Industry | Expandi acceptance | Expandi message reply | Agency post reply |
|---|---|---|---|
| Staffing and recruiting | 36.5% | 18.9% | 18% to 25% (highest listed) |
| Marketing and advertising | 29.4% | 10.6% | not listed |
| Financial services | 26.0% | 10.3% | 10%+ |
| Computer software / SaaS | 27.5% | 8.8% | 4.77% (lowest listed) |
The agency study's partner data tells the same story from another angle: VC/PE and staffing near the top at about 10.5% reply, with retail, consumer electronics and luxury goods near the bottom at about 4.2%.
Seniority matters too. The agency benchmark post, which does not disclose its sample, puts acceptance at 10% to 20% for C-level prospects, 20% to 30% for VPs and directors, and 30% to 45% for managers and individual contributors.
In the agency study, founders and owners reply at 6.4%, below C-level at 7.0%. If you sell to founders, expect lower numbers at both steps: fewer accepts, like any C-level audience, and fewer replies. That comes with the audience and says little about the campaign itself.
If your numbers sit at the bottom of this table, test whether you picked the right market before rewriting a single message.
Campaign type changes the headline number
Most "average reply rate" figures mix cold prospecting with messages to people who are already connected. Those are different jobs.
| Campaign type | Reply rate | Source |
|---|---|---|
| Messages to existing connections (Messenger) | 12.2% | Agency study, Expandi data 2025 |
| Connect, then follow up (Connector) | 7.9% | Agency study, Expandi data 2025 |
| Warm up first, then message (Builder) | 5.4% | Agency study, Expandi data 2025 |
| Open InMail | 7.5% (small sample, 13,600 contacts) | Agency study, Expandi data 2025 |
| Messenger / Template, H1 2026 | 16.86% / 8.62% | Overloop, citing Expandi data |
Every row traces back to Expandi platform data, from two different periods, so the Overloop line is not independent confirmation of the agency study lines.
Both periods point the same way: messaging people you already know beats cold connect-and-follow-up, by about 1.5x in the 2025 data (12.2% against 7.9%) and about 2x against template campaigns in 2026. If a vendor quotes you a 15% reply rate, ask which of these they ran.
Should you add a note to the connection request?
This is where three datasets line up on direction, and the answer is less obvious than most guides make it.
| Source | With a note: accept / reply | Without a note: accept / reply |
|---|---|---|
| Agency study (11.5M requests, Expandi data, 2025) | 25.3% / 8.2% | 27.6% / 5.3% |
| SmartReach (Jan to Jun 2026) | 24% / 22% | 28% / 14% |
| Provider platform data (180,155 requests, reply per accepted) | not reported / 47.8% | not reported / 25.5% |
Two sources show a note costing you a few acceptances, and all three show it buying more replies. Run SmartReach's numbers on 1,000 invites.
With a note: 240 accepted, about 53 replies. Without: 280 accepted, about 39 replies. The note still wins by roughly 14 conversations per thousand invites.
Direct replies to the note are a different story. Expandi's monthly data shows them sliding all year, from 3.5% at the start of its window (May 2025) to 2.2% at the end (April 2026). People accept the note and answer later, if at all.
Here is the rule I use. Write a note when it is about them: a shared context, a reason you picked them, one line. Send the request blank when the only note you can write is about you.
Nothing gets you ignored faster than a pitch in the opening message, and the connection note is the opening message.
What 400 invites a month actually produce
Percentages are hard to plan with. Here is one sender profile sending 400 invites a month, run through the benchmarks above. 400 invites a month often gets treated as a hard limit for everybody. In our client work it is closer to a floor: when an account is active and its acceptance rate is good, it can go up to about 800 a month, as the live client example near the end of this page shows.
| Step | Calculation | Result per month |
|---|---|---|
| Invites sent | 400 | |
| Accepted | 26% to 28.5% | 104 to 114 |
| Replied at least once | 18% of accepted (SmartReach) | 19 to 21 |
| Booked meetings | 1.3% (agency study, SmartReach) to 2.0% (provider study) of accepted | about 1.4 to 2.3 |
SmartReach estimates that a median rep books 1 to 2 meetings a month and a top-quarter rep 4 to 5. That estimate is its own arithmetic on its funnel's 1.3% and a modeled invite volume, so it matches this table by construction and does not confirm it.
Change the audience and the top of the funnel moves. At staffing-level acceptance (36.5%) the same 400 invites give about 146 connections. At software-level acceptance (27.5%) you get about 110.
None of the three meeting sources gives a meeting rate by industry, so I hold it flat here. Staffing replies at twice the software rate, so its real meeting count is probably higher.
Now run it backwards. Ten meetings a month needs about 500 accepted connections at the provider study's 2% and about 770 at the agency's 1.3%, which means roughly 1,750 to 3,000 invites. If I had to budget, I would use the lower rate.
At that volume, spreading the work across several sender profiles beats pushing one account harder, as long as each sender signs in to their own profile. LinkedIn's own weekly invitation and message limits are a separate subject, and they matter here.
Month one of a new campaign rarely looks like month three, either.
What our own campaign numbers look like
For a sanity check, here are three LinkedIn campaigns my team ran, from our published case studies. Their reply rates are per connected contact, so the fair comparison is the 14% to 22% SmartReach range, the agency study's 17.6% and the provider study's 27.6%. The 10.4% per-message figure measures something else.
| Campaign | Invites | Accepted | Replied |
|---|---|---|---|
| Advertising agency, Australia | 3,535 | 1,458 (41.2%) | 553 (37.9% of connected) |
| Business consulting and coaching firm, USA | 98 | 38 (39%) | not reported |
| Software development company, Germany | 84 | 52 (61.9%) | 40 (76.9% of connected) |
The Australian campaign is the one to take seriously. Over 3,500 invites, acceptance sat near the top of the 30% to 45% band Expandi calls good and cleared SmartReach's 40% top-quartile line, and about 16 in every 100 invites turned into a reply, three times the SmartReach end-to-end figure.
The program behind it booked 2,582 sales calls in 12 months, but that total covers the whole engagement, so I do not divide it by the invites above.
The US coaching campaign is the honest middle: 39% sits inside the 30% to 45% band Expandi calls good. On 98 invites that is a small sample, but it shows the band is realistic for a tight list.
The German campaign is 84 invites. That is far too small to be a benchmark, and I show it for the opposite reason. Software sits at the bottom of both reply columns in the industry table above, and a small, well-built list can still beat the average by a wide margin. Averages describe everyone who sends, careless senders included.
Only three meeting rates come from measured data
Meetings are the number you budget against, and they are the least measured step in LinkedIn outreach. Of the six datasets in the table above, three publish a meeting rate from their own data, and only one publishes the number of meetings behind it.
In the agency study's own client campaigns, 1.3% of prospects who connected went on to book a meeting: 14,077 contacts across 34 projects in 2025. By my arithmetic that is about 2,600 connected people and roughly 34 meetings.
The provider study found 2.0% of accepted connections booking one, across 180,155 requests sent between January 2025 and early July 2026, each given 30 days to mature. That is 973 meetings, a much bigger base.
It counts only meetings booked through its own booking step, so it treats the figure as a floor, and its five largest customer workspaces sent 57.66% of the requests.
SmartReach, the second largest platform on this page, reports a first-party funnel that ends at 1.3% of accepted connections, about 3 to 4 meetings per 1,000 invites. It counts a meeting when a rep records one in its tool and reports the figure as a floor. The rate is identical to the agency study's, which SmartReach cites just before its funnel, and it publishes no absolute meeting count, so I treat it as a third, weaker data point and weight it less.
The provider study names the wider problem: circulating LinkedIn benchmarks "tend to cite each other rather than a measurement." When a new page quotes 1.3%, check whether it measured anything or is repeating the agency study.
So here is what I would trust. Taken end to end, the provider study publishes 0.54 meetings per 100 invites and the agency's client funnel works out to about 0.24, because its client campaigns accepted at only 18.7%. That is one meeting per 185 to 410 invites. SmartReach's funnel, 3 to 4 per 1,000 invites, falls inside that range, which fits.
At the platform-average acceptance used in the worked example, the range narrows to one per 175 to 300. Plan on the low end and treat anything better as upside.
And when a vendor quotes you a meeting rate, ask three things: divided by what, measured by whom, and how many meetings sit behind it.
The silence is better documented. SmartReach's own data shows 4 in 5 people who accept (80%) never write back at all, and in the provider study's data about 72% stay silent. A healthy acceptance rate with a mostly quiet inbox is the normal state of LinkedIn outreach.
Bonus: what one live client account looks like
Everything above is averages, and most of it comes from other people's datasets. So here is one real account to hold against them. This is a fresh screenshot from 15 October 2026, taken from the outreach dashboard of a client we run LinkedIn campaigns for: a well-established, very active profile in the consulting space. It shows numbers only, no names.
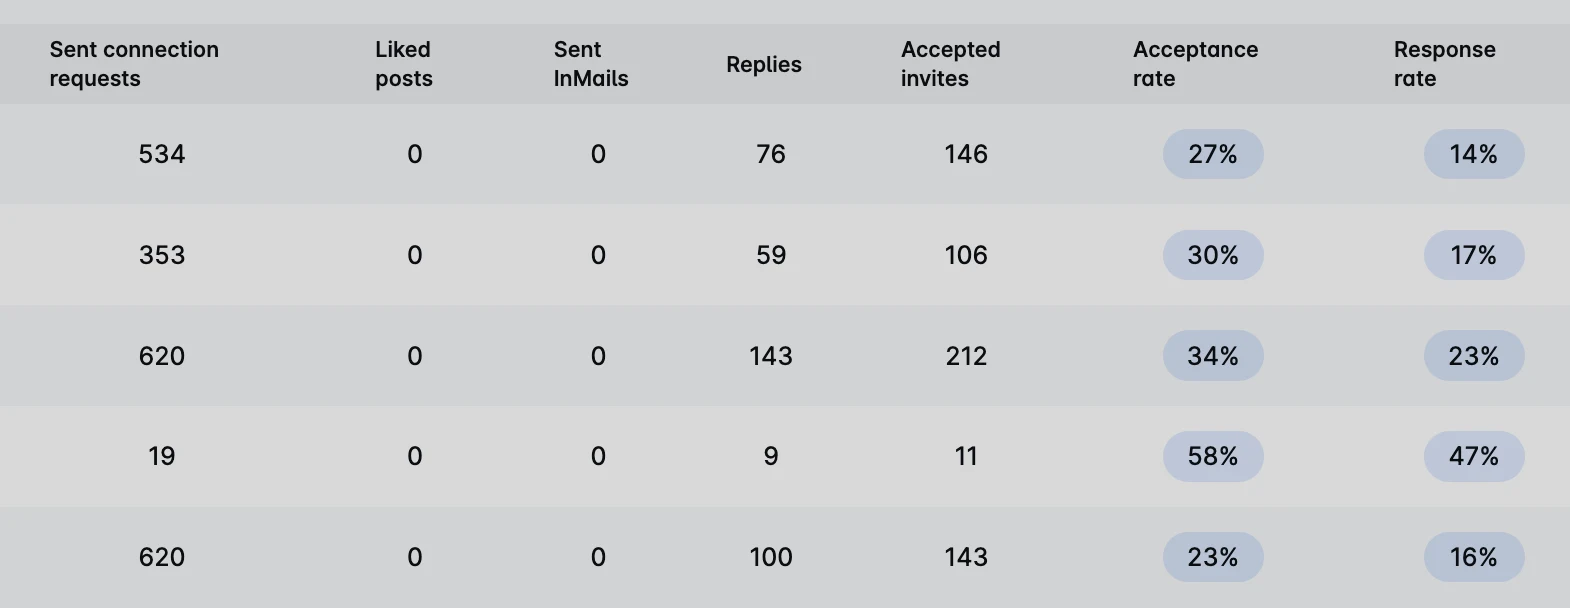 Real client data, 15 October 2026: LinkedIn outreach results from one very active account in consulting. Response rate here is replies divided by requests sent.
Read it with the denominators from this page in mind, because the tool counts its own way. Its acceptance rate is accepted invites divided by requests sent, the same as the table at the top. Its response rate is replies divided by requests sent, not by accepted connections, so it compares with the end-to-end figures rather than the per-connected ones.
As you can see, the rows are all over the place: acceptance runs from 23% to 58% and replies from 14 to 47 per 100 requests. The 19-request row is far too small to mean anything, which is the same warning as the 84-invite campaign above. Across the other four rows, 2,127 requests produced 607 accepted connections (28.5%) and 378 replies. That is about 18 replies per 100 requests, or roughly 62 per 100 accepted connections.
So acceptance sits right on the platform average of 26% to 28.5%, while replies run about three to four times the SmartReach end-to-end figure. A good list and a first message that sells the conversation move the reply numbers far more than they move acceptance.
The account also shows that 400 invites a month is not a limit for everybody. The worked example above assumes 400, and for this client we currently send about 700 to 800 connection requests a month, close to 200 a week, without trouble, because the account is active and its acceptance rate is good. That fits what tool vendors report for established accounts under the weekly invitation limits mentioned above: an older, trusted profile with a steady history of posting and messaging carries more than a new or quiet one.
Treat this as one very specific example, not a benchmark. It is real, live data from one strong account in one industry, and consulting buyers accept and answer differently from the software buyers at the bottom of the industry table. How far your own numbers land from the averages depends on the industry you sell into, how active and trusted the sending profile is, and how tight the list is. Plan with the averages above, and treat an account like this one as upside.
How I read these numbers
Acceptance tells you whether the right people trust the profile enough to click. Replies tell you whether the first message gave them a reason to talk. Meetings are the only one that pays.
So each number points to a different fix. Acceptance under 20% on a manager-level audience: look at who is on the list and what your profile says before anything else.
The profile does more of the work than people think.
Acceptance fine but nobody answers: the first message is the problem. My rule for that first message fits in one line: sell the meeting, not your services. Nobody on LinkedIn accepted your request to receive a brochure. Ask for a short conversation about something they care about, and keep your service out of it until they ask.
On AI-written messages, the data is calm and thin. The agency study found a 7.3% reply rate for campaigns with an AI prompt against 7.0% without, across 3,431 AI campaigns and 62,103 without. SmartReach cites the same test as the only large one published.
Useful, small, and no substitute for the right list. I drew my own line on which parts of outbound AI should touch.
Want to know whether your LinkedIn reply rate is good or just ordinary? Send me a time and bring your campaign counts.
Quick answers on LinkedIn outreach numbers
Is a 20% LinkedIn reply rate good?
It depends on the denominator. Per message sent, 20% is about double Expandi's 10.4% platform average and above even staffing. Per accepted connection, 20% is about average: just above SmartReach's 18%, where 80% of accepted connections never reply, and below the provider study's 27.6%.
What acceptance rate is too low?
Expandi treats anything under 20% as a red flag. But the agency benchmark post puts C-level prospects at 10% to 20%, and the agency study's own client campaigns averaged 18.7%. Judge acceptance against the seniority you target.
Does LinkedIn outreach work better alongside other channels?
SmartReach finds replies run 1.6x higher when LinkedIn is one channel in a sequence that also uses others, compared with LinkedIn alone. It is one vendor's figure with no independent check yet, so treat it as a direction rather than a multiplier to plan on.
How long until these rates are meaningful for my campaign?
Small campaigns swing wildly, as the 84-invite example above shows. Wait until you have a few hundred invites to one audience before you judge it.